Keep Tropical Softs On Notice; Indian Monsoon Season is Weak

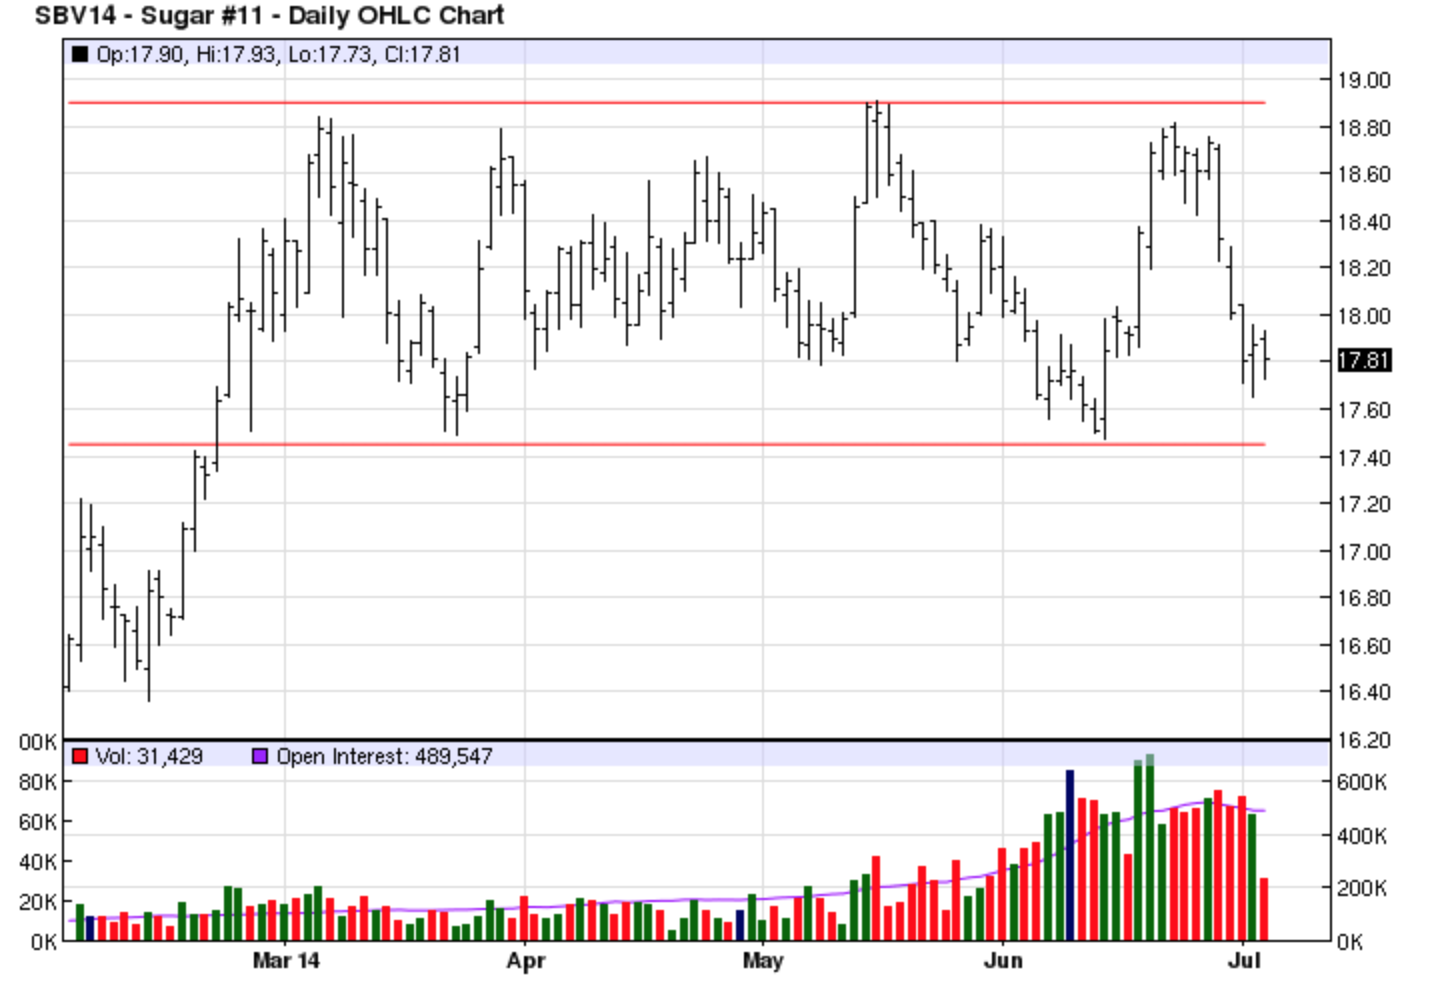
The delayed monsoon season could have tremendous consequences for tropical commodities, particularly those grown in India, such as cotton and sugar, as we saw beginning in 2009. Although these particular commodities are mired in bear trends, El Niño-related weather events can quickly flip the script.

That’s why I’d like to Share this great update on the Indian Monsoon season from Andrew Turner, lecturer in Monsoon Seasons at University of Reading (UK). Enjoy!

India is missing its monsoon, and El Niño could be the culprit

By Andrew Turner, University of Reading

With each monsoon season India waits with bated breath for forecasts from the India Meteorological Department and other international forecasting agencies. This year’s forecast suggested a weakened monsoon, and sure enough for five weeks the monsoon has failed to provide the deluge that is expected.

For India, the monsoon rains typically last from June to September and contribute a whopping 80% of the annual rainfall total. Indian society is therefore finely tuned to the monsoon for its agriculture, industry and water supply for drinking and sanitation. If spread evenly over the whole country, the total rainfall during summer amounts to around 850mm. This year has seen substantial deficit so far, currently standing at about 37% below normal and close to the large deficit in experienced in 2009, which was, like 2002 before it, a year of substantial drought, bringing reduced crop yields and hitting the country’s whole economy.

Now in mid-July, the forecast looks set to improve. The monsoons’ advance northwards across the country has been particularly slow, leading to lack of water for agriculture and prolonged heatwave conditions – in Delhi a week or so ago I experienced temperatures near 40°C due to the absence of rain. In some regions, farmers have had to plant alternative crops that require less water due to the lack of rain, and authorities have diverted irrigation to drinking water, exacerbating their problems.

Anatomy of the monsoon

The monsoons are the biggest manifestation of the effects of the annual seasonal cycle on the planet’s weather. During spring and summer, the difference between the rapid warming of the Earth’s surface and the slower warming of the nearby ocean generates a tropospheric temperature gradient – a strong gradient in air temperature from north to south of the equator, seen in South Asia most strongly over northern India and the Tibetan Plateau. This temperature gradient stretches far up into the atmosphere forming a difference in pressure, stretching from high pressure over the southern Indian Ocean to low pressure over India. The result of this pressure gradient is the seasonal winds we know as the monsoon, which carry moisture to supply the monsoon rains across Asia.

The onset of the monsoon rains typically comes at the beginning of June, with the weather front stretching from the southwest Indian state of Kerala across the ocean to cover the states in the far northeast of India. For Indian society, and especially farmers, knowing about any variation in the intensity and duration of the monsoon and when it will start is vital. The progression of the monsoon across the country normally takes around six weeks, reaching the border of India and Pakistan by around mid-July. In September, the monsoon withdraws in the opposite direction, and as a result northwest regions experience a much shorter monsoon season and consequently greater pressure on water resources.

Change is coming

So why has it been happening? While a full study won’t be carried out until after the season, it is likely that it relates to El Niño – a warming of the central-to-east Pacific Ocean along the equator that happens every few years, changing seasonal weather patterns in many parts of the world but particularly around Indian and Pacific Ocean regions.

For India, El Niño is generally associated with monsoon drought. The remote interaction with the monsoon (known as teleconnection) is caused by a disruption to the normal trade winds in the Pacific and Indian Oceans, known as the Walker Circulation after Sir Gilbert Walker, a British meteorologist in India who sought to predict when the monsoon would fail.

Rising air and enhanced rainfall meet over the warm ocean surface during El Niño, much further east than Indonesia as is usual. But what goes up must come down, and these shifts in the circulation lead to descending air over India, which reduces the strength of the monsoon. Research has also established that El Niño can delay the monsoon’s onset, shortening the duration of rains over India.

A major concern is that the monsoon will be changed by global warming. However, all the indications from our climate models are that the Indian monsoon will continue to supply the region with strong seasonal rainfall. In fact most suggest that greater concentrations of atmospheric carbon dioxide will bring more, rather than less, rain. So far, so good – but the monsoon’s rains are not a statistical average spread equally on each day and in each location. Model simulations also suggest that tropical rainfall will tend to be heavier when it occurs, with potentially longer dry periods between rain events. Both of these factors have important implications for water resources, including crop damage as well as increased flooding.

With El Niño conditions forecast to grow in the Pacific throughout the rest of 2014, the full impact on this summer’s monsoon will depend on if the forecast comes true and the location of where El Niño occurs. What we can’t yet say with any certainty is how El Niño’s link to and effect on the monsoon will change under warmer future climate conditions – we only know that greater extremes of variability are likely, and a more variable monsoon may be a problem.

Andrew Turner receives funding from the UK Natural Environment Research Council and the India Ministry of Earth Sciences. This article was originally published on The Conversation.

Read the original article.

Time to Pour Some Sugar Futures into Your Portfolio?

Down and out sugar may provide the boost your portfolio needs in the second half of the year. 

Since hitting its all-time contract high back in February 2011 at more than 36 cents, sugar has experienced a relatively steady five-year decline into the teens as ideal weather helped boost yields from Brazil to India.

Lately though the global ICE raw sugar contract #11 $SB_F has gotten rather sleepy. Checking the daily chart, the front-month contract has consolidated into a two-and-a-half cent range between 17.5 and 19 cents dating back to February.

Screen Shot 2014-07-06 at 6.55.37 PM

What could break sugar’s sleepy spell? El Niño.

In fact, the last time sugar experienced the bull market run of a generation, between 2009 and 2011, it was the last time we had a significant El Niño event. A combination of deadly flooding in Pakistan, a deeply disappointing rainy season in India and uncooperative weather in Australia led to record prices with an initial peak above 30 cents in February 2010 and then its all-time high a year later.

This time around though the world has more sugar than it needs. In fact, the expired July contact saw its lowest delivery of raw sugar since 2000 thanks to the supply glut. Furthermore, the International Sugar Organization forecasts global production will exceed demand for a fourth straight year in the season ending in 2014. This kind of data is making analysts and futures traders wax bearish. But there is one problem: prices can’t seem to break 17.45.

Instead, let’s discuss a vastly different scenario that remains as-of-this-moment extremely plausible.

With forecasters predicting a 90% chance of El Nino this year, sugar crops from Australia to Brazil and India are vulnerable. In a typical El Niño cycle, the Indian monsoon cycle is weaker than usual, leading to below-average rainfall and thus smaller sugarcane yields. And so far this cycle is looking weaker for the world’s second largest sugar exporter. In fact, experts have already started calling for a drought with monsoon rains at their lowest level in five years.

In the short term, the market appears to be balancing the weather concerns with the voluminous supply. Who knows, rains may return (like for wheat crops in the Midwest) or remain elusive. Once this months-long trading range is broken, I’ll look to enter long above 19 cents or short below 17.50, depending on how the market plays out.

For now we must wait for Mother Earth and the whims of price action to determine our move.

Palladium: The Precious Metal Continues to Shine Brighter than the Rest

In a year expected to punish the precious metal group, which saw tremendous triple-digit gains dating back to mid-decade on the back of investor fear, one metal forgot the script: palladium. Thanks to a combination of bullish fundamental and technical phenomena, this backwater outpost of the CME has quietly produced year-to-date gains of 18% with plenty of upside to go. Gold and silver meanwhile have returned 4% and -2.6% YTD, respectively.

Primarily added to the catalytic converter in your car to absorb harmful emissions, investors in the know have also been adding palladium to their portfolios at a steady clip. Heck, South Africa launched a new palladium ETF in March. Meanwhile, interest has spiked in $PALL (the most popular palladium ETF) and speculative long positions continue to build in the futures market.

What is driving this impressive bull market? To name a handful of many reasons:

  • A multi-year supply deficit.
  • The improving economy as car sales surpass 2007 highs, at least stateside.
  • Renewed cold war tension between Russia (the world’s largest supplier) and NATO.
  • Speaking of Russia, Russian palladium flows to Switzerland (its main palladium exporting partner) rose to an 11-month high in April and still the price rose 4%.
  • A five-month long strike in South Africa (the world’s second largest supplier) with seemingly no end in sight.
  • The multi-year consolidation breakout about $750/ounce, first noted by All Star Charts.

Palladium is the type of market I love; it has all the pieces a trend follower needs: a strong bullish technical breakout, numerous bullish fundamentals and strong bullish investor sentiment.

Although Palladium has had quite a run, from a technical perspective it has much further to go, perhaps even to its all-time highs above $1,100 per ounce set in 2001. The before-mentioned cold war tensions in Ukraine may ease and the South African platinum/palladium miners may return to work, it may even hit technical resistance around the 2011 high of $865 an ounce, but I’m willing to bet it will bounce back from those temporary bearish events and climb higher.

P.S. I am long the CME futures contract for palladium, offsetting my losses from Arabica coffee I love so much 🙂


Why Arabica Coffee is Heading Higher…Much Higher

The darling of this year’s commodity markets, arabica coffee, which at one point reached a return of 90% since the start of the year, has been taking a beating lately. On Friday, the July 14’ ICE coffee (KC) contract experienced its biggest one-day drop since 2011 of more than five percent, this after jumping 12 cents higher Thursday following Brazil’s Confab bureau announcement which cut the total coffee production estimate to 44.7 million bags.

The volatility has been wild in the past few months to say the least and it will probably continue, especially as the long-awaited harvest reports from Brazil start trickling in later this month.  If these initial reports come in more positive than expected, we can expect coffee to keep grinding lower in the short term.

Looking at the July 14’ coffee chart, major resistance sits at the March low of 166. If that breaks, the technical momentum could quickly end this bull market faster than it started. Yet I believe the reality of the dwindling supply situation will reassert the bullish trend and push prices back well above 200.

Did coffee double top or is this a pause in the long-term bull trend?

Did coffee double top or is this a pause in the long-term bull trend?

But don’t take my word for it.

Judith Ganes-Chase, a long-time soft commodities analyst, told Agrimoney.com last week “In all my 30 years of covering commodities, I have not seen anything like this before” in reference to the supply concerns for coffee. She argues that the remaining estimated stocks for Brazil are not of good export quality, meaning that the supply cushion expected to absorb the drought losses may be worthless to buyers.

If she’s right, we may very well see prices top 300, perhaps even test the all-time high set in 1997. But right now the market is focused on global stocks estimates, with other analysts claiming the Brazil drought is already priced in along with other bullish news including El Nino, roya problems in South America and the replanting of robusta trees in Vietnam.

If you’re a long-term bull like me, sit on the sidelines for now until we can establish another upturn. For the bold, try to ride out the uncertainty with a very wide stop.

The risk is big but the reward could be much, much larger.

The El Nino Commodity Trading Guide: Watch Out For Wheat

With each passing week it appears the odds are increasing for the weather phenomenon known as “El Nino.” Check that…the odds are increasing for a “Super El Nino.”

Yeah, sounds serious.

The last time we had one of those was in 1997-1998. Forecasters suggest the probability of an El Niño is now above 70%, which I hear is an unusually high probability estimate considering the time of year, hence the “super” talk. Of course, high probability does not mean certainty and especially this early in the year; it could be a repeat of 2012 where in the 11th hour El Nino never materialized.

While we anxiously await the latest Pacific Ocean temperature readings, history tells us that El Nino years can significantly influence commodity prices across the globe. The Wall Street Journal recently came out with a useful infographic on key commodities that often experience price spikes including coffee, wheat, corn and cocoa as well as metals such as copper and nickel. Apparently El Nino usually leads to excessive rains in Chile that can flood copper mines.

Of the list, wheat is the most intriguing. The Chicago wheat contract bottomed out around $6 per bushel in March thanks to healthy worldwide stocks. However, those numbers are being slashed as I type thanks to a combination of winterkill, dry weather and now excessive heat in the main winter wheat growing areas of Texas, Oklahoma and Kansas.

The main winter wheat growing areas of California and the plains are smack in the middle of severe drought areas

The main winter wheat growing areas of California and the plains are experiencing severe droughts

On top of that, the crisis in Ukraine continues unabated, adding even more risk premium to a market that fears unrest will curtail exports and possibly reduce yields. Throw in a dry growing season in Australia, a common occurrence in an El Nino year, and we have another fundamental bullish bit of news to keep the market climbing.

As of this writing, the front-month Chicago wheat contract sits around $7.35 as it continues its bullish price trend off the March lows. It’s still early to start talking about breaking the contract high of $13 per bushel, but the game pieces are in place for that potential.

Wake Up and Smell the Coffee Bull Market

Last fall I wrote about the possibility for a correctional bounce in arabica coffee after a nine-month-long bear trend that took the price of coffee down around $1.00/pound. That little correction turned out to be a major turning point for coffee, setting off a bull trend that more than doubled the front-month contract price by March.

When coffee analysts and traders were unanimously bearish (including yours truly) last November, it marked a major bottom. Weather served as the main agent of change, as is often the case with agricultural commodities. The major growing regions of Brazil experienced a serious drought at the beginning of the year, setting off a dramatic and swift rise that may well run coffee to $4 or higher.

In just a month, talk of another year of oversupply has turned to one of scarcity.

After hitting almost $2.10/pound, coffee experienced a near perfect Fibonacci correction to its 68.1% retracement level. Some recent rains and some choice comments from Starbucks CEO Howard Shultz in Reuters where he said the market “significantly overreacted,” to the Brazil drought news helped knock down the price. And just last week Starbucks announced the reduction of some retail coffee prices. Ironically, the May arabica coffee contract shot up more than five percent on Friday (the day the Starbucks pricing news hit the press) breaking out of its two-week-old consolidation pattern.

According to analysts, there was nothing fundamentally noteworthy to precipitate the advance, arguing that the jury is still out on the level of crop damage in Brazil.

The May Arabica Coffee Daily Chart Looks Poised For Another Run Higher

The May Arabica Coffee Daily Chart Looks Poised For Another Run Higher

Will the breakout on Friday I’m willing to take a chance and go long, placing my stop below the March low. However, for this one I’ll be looking at the iPath DJ-UBS Coffee Subindex ($JO). The volatility can be extreme during coffee weather events and I’ll be better able to manage my risk…I hope. Coffee opens hours before the stock market and price action can lead to big gaps.

The Return of the Almighty Dollar

When the housing crisis morphed into the credit crises in 2008, many of my fellow Americans—and the world—lamented about the decline of the United States as a world power. Flash forward six years later and the script has flipped. The good ol’ U.S. of A is once again viewed as a paragon of economic strength as emerging markets have struggled (think Russia, Brazil and China) and political crises in Eastern Europe, the Middle East and Africa have reignited talk of “flight to quality.”

Yet all the big talk has failed to generate America buying in the first quarter. Although the U.S. stock market has climbed above all-time highs, the market hasn’t maintained last year’s pace.

The dollar has fared worse as the U.S. Dollar Index has lost almost one percent in the first quarter, all despite the Fed’s ongoing tapering program and hints at rising interest rates as early as next year.

From a technical perspective the dollar index has built a strong, multi-year base below 80. Since November 2010 when the index hit 78, the U.S. dollar index has tested the 78-79 range at least six times and failed to break through (see the red line below).

The U.S. Dollar Index Weekly Front-Month Chart

The U.S. Dollar Index Weekly Front-Month Chart

Long term, buying the dollar index looks like a low-risk, high reward trade with a stop below the trendline—should the U.S. economy continue to chug along. After the latest fed press conference a few weeks ago, the dollar index shot up above 80 after bottoming around 79.3 on March 10. Now maybe as good a time as any to jump in on the long side.

Although the dollar index looks attractive, maintain flexibility. If things change unexpectedly, a break below 79 represents an excellent short opportunity.

Where I’ve Been

It has been months, January 29 to be exact, since I last updated this blog. It’s time to explain where I’ve been and what I’ve been up to. Originally, when I accepted a new position at R/West Marketing, I planned to update this blog once a week. That has not happened and I apologize.

Transitioning back to full-time work has been rewarding but also tiring. There is only so much time I can sit in front of a computer without driving myself (and my wife) crazy. At the same time, my wife has made a job change as well. Last month she accepted an offer that has moved us from the Willamette Valley to the high desert of Central Oregon.

With my new location I’ve debated changing the name of this blog to the “High Desert Trader” to reflect my new surroundings. In the end, I’ve decided to keep it “Rip City Trader.” Although I no longer live in Portland, it will always be my hometown.

And now that we have settled into our new residence, I vow to maintain my pledge to blog at least once a week beginning now. My hope is that my once growing audience returns and we can resume the verbal scrum between bulls and bears in the world’s futures markets.

Despite the massive changes in my life these past few months, I have continued to trade with my attention squarely upon palladium. It’s a market I’ve been watching for a while that experienced an impressive multi-year breakout from consolidation a few weeks ago. Thanks to a perfect storm of fundamental and technical phenomena, palladium looks like the trade of the year. As events unfold in key mining countries, South Africa and Russia, as well as the global economy, I’ll keep you updated with technical analysis mixed in for good measure. Although I like to debate the merits of fundamentals, at the end of the day I am a technical trader and base my trading system upon technical analysis.

Stay tuned for my next blog post soon…it covers another market that I’m excited about both from a fundamental and technical perspective that presents another potentially profitable opportunity. 🙂

When Will Range-Bound Soybeans Break Out?

In the grain markets 2013 ended with a whimper and has continued to whimper through January. After a phenomenal harvest in North America, especially after the drought of 2012, both the corn and wheat markets remain mired in long-term bear markets. Soybeans have held on to maintain contact with the teens…more on that later.

Corn, especially, has been grinding lower within a tight range; its average true range on the daily charts has dropped below six cents a bushel. Chicago wheat has lost a dollar per bushel in the past two months thanks to large global stocks and a lack of strong demand. Technically, Chicago wheat is vastly oversold and can’t seem to bounce higher despite the threat of Midwest winterkill and recent purchases from the Middle East and Asia.

Soybeans Avoid the Doom and Gloom

Soybeans have managed to defy gravity, or at least stave off a full-blown bear market. The reasons cited are innumerable, with shear demand for North American soybeans as the prime culprit. Soybean orders for the current marketing year remain far ahead of the USDA estimates and the rates of the recent past. Traders keep expecting to see cancellations with the South American harvest around the corner but that isn’t happening, keeping prices buoyed.

Regardless of the reasons, the price tells the story.

After the front-month soybeans contract touched $14 a bushel during the end of August, it has settled into a dollar range between $13.50 and $12.50 per bushel. The bulls and bears are fighting for control and lately the bears have managed to keep the price below the teens with eyes toward a big South American crop. Recent rains in Argentina have calmed fears about heat-stressed soybeans and initial harvest reports from Brazil are pointing to expectation-beating yields.

The potential symmetrical triangle forming on the weekly soybean chart suggests a breakout coming soon.

The potential symmetrical triangle forming on the weekly soybean chart suggests a breakout coming soon.

Each week I keep thinking soybeans will give way to the 11s, but each week a new bullish storyline emerges, including:

  • The Devaluing of Argentina Pesos: With double-digit percent loses in the currency, Argentinian farmers may be reluctant sell soybeans.
  • Lack of Improved South American Infrastructure: South America has emerged as the world’s top soybeans exporting continent, with Brazil at the top. However, the ability to physically export the increasingly larger crop each year has not kept pace. Last year buyers waited months to get their beans thanks to logistical issues at Brazilian ports. The USDA attaché in Brazil called the logistical improvements “marginal” – not exactly instilling confidence in global soybean buyers.
  • China Using Soybean Import Contracts as Loan Collateral: Due to tightening credit markets in China and the government cracking down on shadowing banking, DTN’s China correspondent Lin Tan, speculates that private companies can gather “credit from the bank much easier by using soybean import contracts as collateral because it’s normal import business.” He estimates that China may cancel 73.5 million bushels worth of soy, but so far that hasn’t materialized.
  • Threat of February Dryness: Although South American growing regions have experienced solid rains lately, there remains risk premium in the market should the weather turn dry.

Despite these recent developments, longer-term data remains bearish. Oil World told Bloomberg World production of soybeans will be 287.8 million tons, up from an estimate in December of 287.6 million tons. Furthermore, the spread Between North and South American soybean prices provides a dollar-per-bushel discount for those buying from Argentina, for example, versus the U.S.

Heading into the next few months, I maintain a bearish bias looking for a downside breakout below the $12.50-60 range. However, should the situation continue to evolve and gain bullish momentum, I’ll be looking to enter above the December highs of $13.50 should we get there.

For now, I will sit tight and wait for the breakout.

The Top 10 Handles for Grain Futures Trading on Twitter

Want to stay up on real-time news and data for agriculture futures? These 10 pros on Twitter are a great place to start.

10) Angie McGuire (@GoddessofGrain) – The Goddess of Grain is VP of Grains for Citizens LLP and is guaranteed to provide a few chuckles. She mixes in her grain market tweets with plenty of sass and humor. She often has her ear to the ground concerning the rumors and chatter that surround the cash basis for grains, which at times can be useful for tracking price in the futures markets.

9) Agriculture.com (@Agriculturecom) – Agriculture.com is a superb media property for tracking the daily market movements of soybeans, corn and wheat. Its Twitter handle provides a useful method for staying up on the site’s freshest, most important market commentary. They have a reporter on the CBOT floor who provides play-by-play commentary of the action in the pits.

8) Dave Fogel (@ATI_DaveFogel) – David brings nearly 30 years of agriculture risk management experience to his Twitter account and it shows. Based in Bloomington, Ill., he stuffs his Twitter stream with updates on grain basis and insights from across the globe I wouldn’t otherwise know about. His no nonsense approach to Twitter provides breezy, easy-to-understand summaries of what matters most to grain buyers and sellers—vital information for any grain trader.

7) Gavin Maguire (@RtrsAgAnalyst) – Gavin is an agriculture columnist and analyst for Reuters who is a big picture thinker with gorgeous fundamental grain charts to match. For example, for the January 10 USDA report, he posted on Twitter a graph of the daily corn, wheat and soybean markets reactions to the report dating to 1986. That’s great stuff you won’t find easily for free.

6) Julianne Johnston (@julijohnston) – I’ve discovered that grain market analysts are primarily male, but that doesn’t stop Julianne from providing some of the best market commentary and insight around. Working for Pro Farmer, she is always there to provide timely export, cash basis and insights from around the Pro Farmer ecosystem. When its crop report time I make sure to keep close tabs on her handle for updates.

5) Jason Britt (@jasonlbritt) – This broker out of Missouri isn’t afraid to call it likes he sees it, providing an inside look at the psyche of a trader. He also shares the wealth, posting timely articles and keen insights from other industry experts. Topics include the weather and juicy rumors from his network that would be otherwise impossible for outsiders like me to ever hear about.

4) Tregg Cronin (@5thWave_tcronin) – A self-described “futures trader/technician/production ag/Canadian whiskey advocate” from South Dakota, he provides very unique and in-depth analysis of all types of agriculture products from the traditional grains to farmland prices to milk futures. Anyone curious about smaller agricultural markets best pay attention to Tregg’s tweets.

3) Bryce Anderson (@BAndersonDTN) – During the great Midwest drought of 2012, I was glued to Bryce’s Twitter feed. He is the senior agriculture meteorologist for DTN and provides real-time updates on weather patterns and forecasts for the world’s important grain growing regions. He does not tweet every day but when he does Tweet, I never fail to take a look.

2) Darin Newsom (@DarinNewsom) – Based out of Omaha, Nebraska, Darin is arguably the most talented pure writer out there I’ve found covering the grain markets. Equally versed in fundamental and technical analysis, his “technically speaking” blog is can’t miss stuff. From time to time he will also provide insightful technical analysis on outside markets, including oil and gas. Although a lot of his content resides behind a firewall at the DTN Progressive Farmer website, he provides plenty of invaluable information for free via Twitter.

1) Arlan Suderman (@arlanFF101) – When it comes to the grain and cattle markets, Arlan is your guy on Twitter. Not only does he provide superb information on what he is seeing for corn, soybeans, wheat and cattle, he does so seemingly effortlessly and immediately. He is the one I turn to first when the latest USDA report crosses the wire. As a senior market analyst for Water Street Solutions, Arlan is primarily focused on fundamentals and leaves some of the hardcore technical charting to others.

Honorable Mentions

There are way more than 10 great follows on Twitter for grain traders so I encourage you to also check out @IndianaGrainCo, @StandardGrain, @WhiteWheatTweet, @morrisonmkts and @TonyRohrs to name a few more. They all provide great insight into what’s happening in the markets.

Who do you recommend following on Twitter?